HIGHER EDUCATION · ACADEMIC PLANNING
Academic Portfolio Intelligence
Turning fragmented academic-program data into confident portfolio decisions.
Universities regularly decide which academic programs to launch, expand, reposition, consolidate or retire. Yet these decisions are often shaped by disconnected reports, lengthy market research and incomplete views of student demand, competition and financial opportunity.
I led the product design of Academic Portfolio Intelligence, a decision-intelligence experience within 3E ForwardIQ Academics. The platform helps higher-education leaders evaluate program opportunities, understand market position, assess portfolio health and model how academic-program decisions may influence enrollment and revenue.
PROJECT FOCUS
From isolated program analysis to portfolio-level academic planning
Connecting program demand, competition, market share, opportunity assessment and portfolio planning in one enterprise experience.
The Decision at a Glance
SITUATION
Fragmented evidence slowed portfolio decisions
Academic leaders needed to make consequential decisions about program growth, investment and portfolio direction. However, the information required to evaluate those decisions was distributed across enrollment reports, degree-completion data, market research, competitor information and financial assumptions. Program reviews could become slow, fragmented and overly dependent on historical information or institutional opinion.
TASK
Create a shared academic-planning model
My responsibility was to design a connected planning experience that helped leaders evaluate program viability, understand demand and competition, compare opportunities across the portfolio, identify gaps and explore the potential implications of academic-program changes.
ACTION
Design around the portfolio decision
I mapped the academic-planning decision process and structured the product around three connected layers: Assess the current portfolio → Identify strategic opportunities → Model the future program mix. I led the design of the program-assessment experience, opportunity-scoring model, portfolio-planning workflow, program-mix analysis and scenario-comparison experience.
RESULT
One connected environment for academic planning
The platform created a shared planning environment for academic-program evaluation. Leaders could examine program demand, market position, competitive presence and financial opportunity within one connected experience—then compare potential changes before selecting an academic-investment direction.
Product Capabilities
Academic Planning Was Built Around Fragmented Evidence
Academic-program decisions affect enrollment, institutional identity, faculty investment, marketing priorities and long-term financial sustainability.
Yet the information needed to make those decisions was often distributed across separate teams and reporting systems.
Existing Reports Explained Parts of the Picture
Academic leaders could review:
- Historical enrollment
- Degrees conferred
- Program-level performance
- Student-demand information
- Labour-market research
- Competitor offerings
- Tuition and revenue assumptions
- Faculty and institutional capacity
Each source provided useful evidence, but no single view connected the complete academic-portfolio decision.
Leadership Needed Portfolio-Level Answers
- Which programs have the strongest future opportunity?
- Which existing programs may be losing relevance?
- Where is student demand growing?
- How saturated is the competitive market?
- Which institutions currently control market share?
- Which programs could support enrollment growth?
- Where might the institution have an unmet portfolio gap?
- How could a new program affect the existing program mix?
- Where should institutional investment be prioritised?
The Existing Planning Workflow
Identify a program for evaluation
A program or subject area was selected based on institutional priorities, emerging questions, enrollment performance or perceived market opportunity.
Fragmented Program Intelligence
Demand, enrollment, competition, market share and financial information were reviewed through separate reports and tools.
Slow Planning Cycles
Traditional program and market research could take months, limiting an institution's ability to respond quickly to changing demand.
Reactive Decision-Making
Programs were often evaluated after enrollment decline, competitive pressure or portfolio imbalance had already become visible.
Isolated Program Decisions
Programs were frequently assessed one at a time, without a clear view of their relationship to the wider academic portfolio.
THE DEEPER PROBLEM
The institution did not simply need another academic-program report.
It needed a shared way to decide which programs should be grown, built, repositioned or reconsidered—and why.
Move from Program Reporting to Academic Decision Intelligence
FROM
How has this program performed?
TO
What role should this program play in the future academic portfolio?
"How might we help academic leaders evaluate program demand, market position, portfolio fit and financial opportunity before committing institutional resources?"
My Mandate
As Lead Product Designer, I was responsible for translating a complex academic-planning model into an experience that could support both executive and analytical users.
Success Criteria
Key Constraints
Multidimensional Decisions
Program viability depended on market demand, enrollment, competition, degree production, institutional performance and financial opportunity.
Different User Needs
Provosts and senior leaders needed a concise view of opportunity and risk. Analysts needed access to the evidence behind the assessment.
Institutional Context
A program that represented an opportunity for one institution might not be appropriate for another.
Data Density
The platform needed to communicate significant analytical depth without recreating the complexity of traditional market-research reports.
Trust and Decision Sensitivity
Academic-program decisions involved institutional priorities, faculty interests and long-term investment. Users needed to understand how opportunity assessments were formed before relying on them.
Understanding the Decisions Behind Program Reviews
Discovery focused on how academic leaders evaluated programs, which evidence influenced their conclusions and where the existing process created delay or uncertainty.
The objective was not simply to consolidate more data. It was to understand how leaders moved from evidence to an academic-investment decision.
Workflow Mapping
I mapped how academic-planning information moved between:
The challenge was not the absence of information. It was the difficulty of connecting information into a coherent portfolio decision.
INSIGHT 01
Leaders Were Looking for Confidence, Not More Reports
Academic leaders did not simply want additional data points. They wanted to know: "Is this a meaningful opportunity for our institution?" This changed the product hierarchy. The experience needed to lead with strategic meaning and then reveal the supporting evidence.
INSIGHT 02
Program Viability Was Multidimensional
No single metric could determine whether a program should be launched, expanded or reconsidered. A meaningful assessment required student demand, degree-production trends, market growth, competitive intensity, market share, institutional performance, enrollment opportunity, financial opportunity and portfolio fit.
INSIGHT 03
Market Demand and Institutional Opportunity Were Not the Same
A fast-growing field did not automatically represent the right institutional opportunity. Leaders also needed to understand competitors, institutional position, market saturation, portfolio priorities and potential enrollment contribution.
INSIGHT 04
Individual Programs Needed Portfolio Context
Evaluating programs in isolation could create a portfolio that was unbalanced, duplicative or disconnected from institutional strategy. Leaders needed to see how each program contributed to the overall mix.
INSIGHT 05
Scoring Could Accelerate Understanding
Raw data required users to interpret multiple reports before forming a conclusion. A transparent opportunity score could create faster executive understanding—provided users could inspect the evidence behind it.
INSIGHT 06
Academic Planning Was Already Scenario Planning
Leadership discussions naturally included questions such as: What happens if we launch this program? What happens if degree volume changes? What happens to enrollment, revenue or the wider program mix? The existing process did not make those relationships easy to explore.
INSIGHT 07
Speed Matters When Markets Change
Lengthy research cycles increased the risk that institutions would act on outdated demand or competitive information. The experience needed to reduce the distance between identifying a question and evaluating its strategic implications.
Designing Backward from the Portfolio Decision
The central design challenge was not simply creating an academic dashboard.
It was designing a connected decision process that moved from fragmented program evidence to a defensible portfolio direction.
DEFINE THE PLANNING OBJECTIVE
Clarify whether the institution is exploring growth, portfolio optimisation, new-program development or program review.
ASSESS THE CURRENT PORTFOLIO
Create a shared view of current programs, performance, market position and program-mix health.
EVALUATE INDIVIDUAL PROGRAMS
Connect demand, competition, degree production, market share and institutional performance.
IDENTIFY STRATEGIC OPPORTUNITIES
Use a consistent opportunity model to surface programs that deserve deeper evaluation.
MODEL PORTFOLIO CHANGE
Explore how adding, growing, repositioning or reducing a program may affect the broader portfolio.
COMPARE STRATEGIC ALTERNATIVES
Evaluate the implications of different program mixes and investment directions.
ALIGN AROUND A DIRECTION
Surface the evidence and rationale required to communicate an academic-planning recommendation.
Three Decision Layers
ASSESS
What is the condition of the current portfolio?
Understand existing programs, market position, opportunity distribution and program-mix health.
IDENTIFY
Where are the strongest opportunities or risks?
Evaluate individual programs using demand, competition, market share and financial-opportunity signals.
PLAN
How should the future portfolio change?
Model potential program additions, adjustments and portfolio scenarios before committing resources.
Design Principles
01
Decision Before Detail
The primary view led with opportunity, risk and strategic implication. Supporting metrics remained available beneath the conclusion.
02
Portfolio Before Program
The experience helped users understand the whole portfolio before optimising one program in isolation.
03
Transparent Opportunity Scoring
Opportunity assessments remained connected to the data and factors that influenced them.
04
Progressive Disclosure
Senior leaders could understand the strategic implication quickly. Analysts could inspect demand, market share, competition and other contributing information.
05
Comparative Context
A program's performance was shown relative to competitors, markets and other programs—not as an isolated number.
06
Signal Over Noise
The interface prioritised meaningful differences, gaps and opportunities instead of displaying every available data point with equal visual weight.
07
Cause and Effect in One View
Changes to program volume, mix or assumptions remained connected to their possible enrollment and financial implications.
08
Planning as a Portfolio Activity
The experience supported institutional trade-offs rather than treating every program as an independent opportunity.
Core Product Experience
PRODUCT SCREEN 01
Program Portfolio Overview
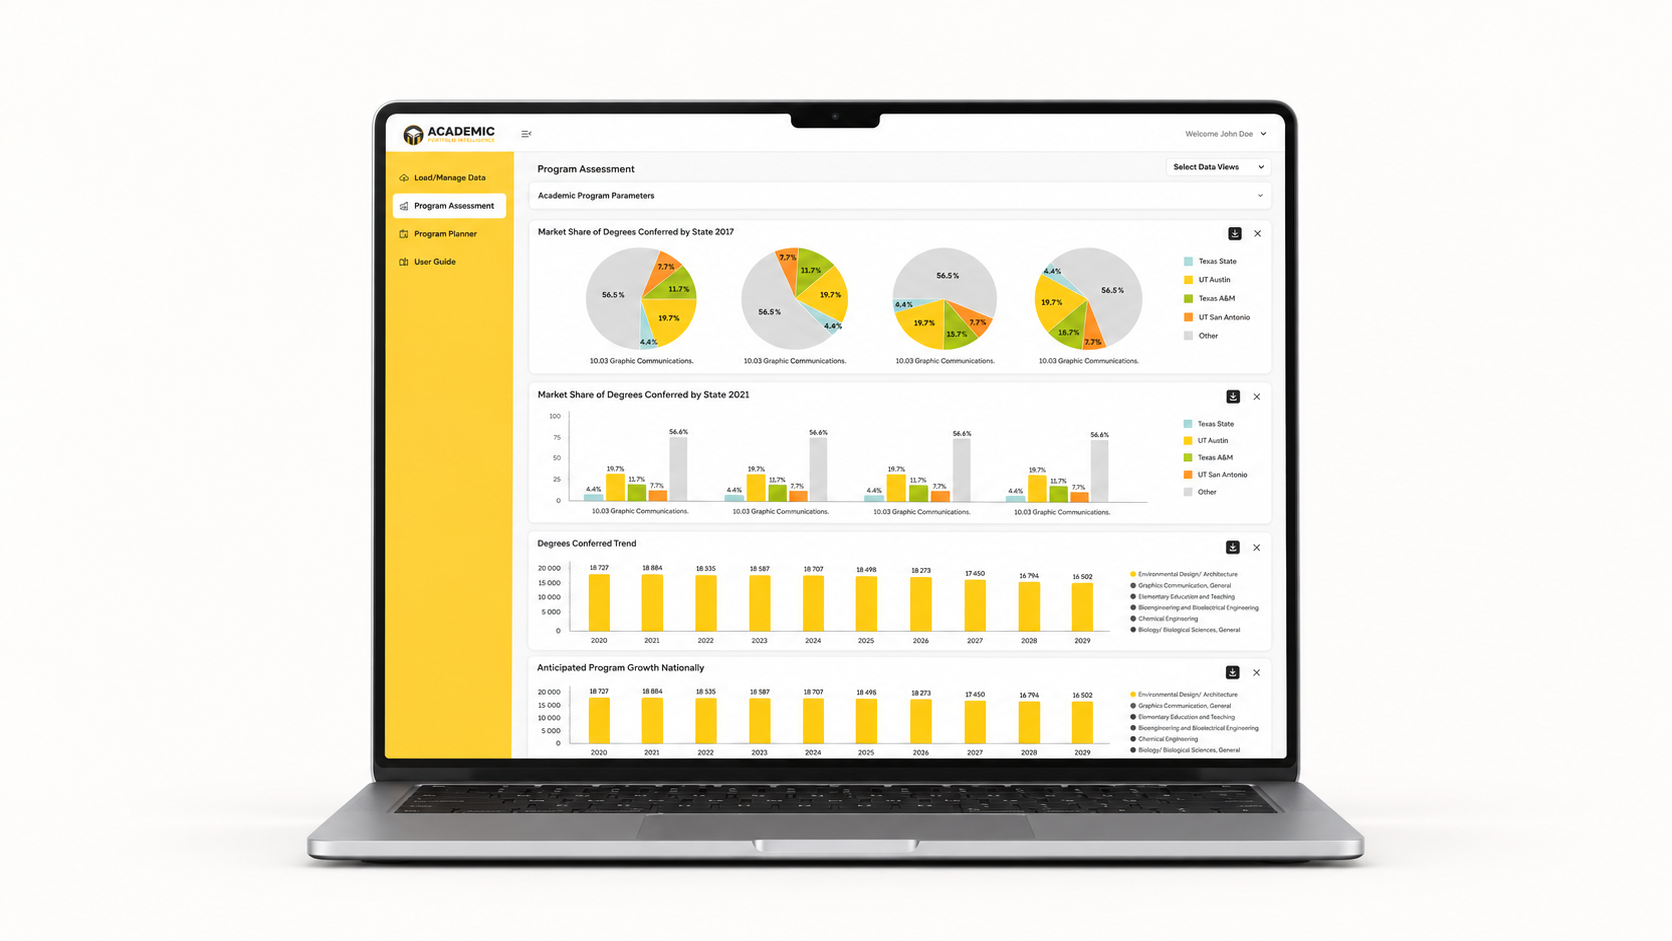
Program Portfolio Overview — A unified view of academic programs, opportunity scores and portfolio health.
PRODUCT SCREEN 02
Program Demand & Market Analysis
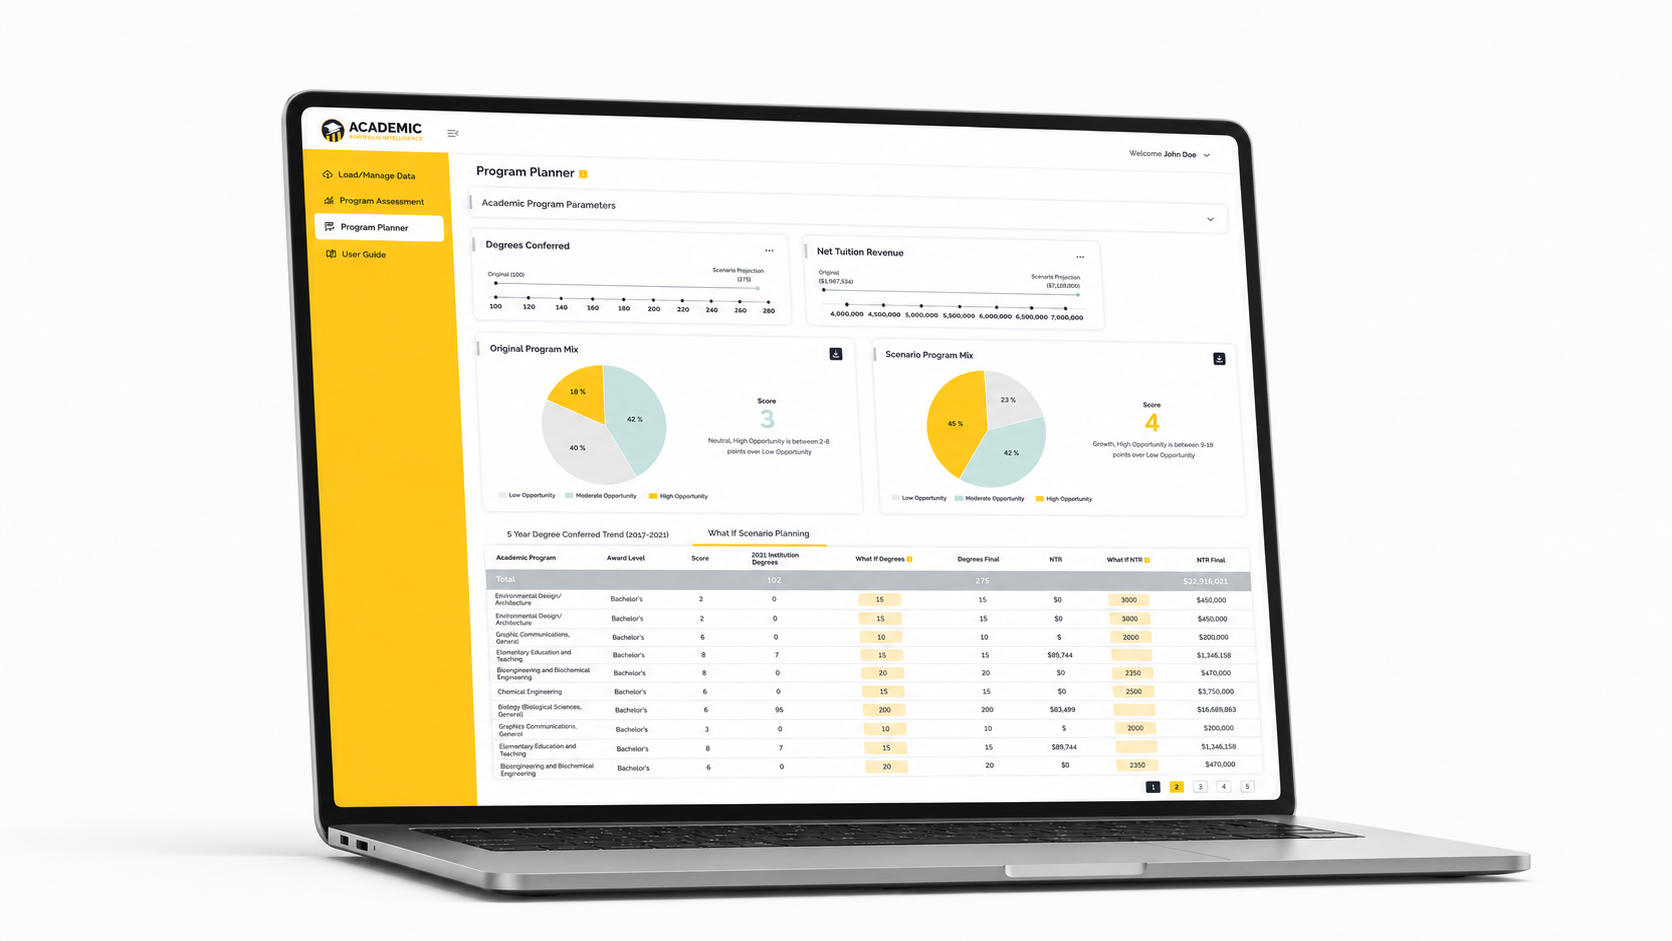
Program Demand & Market Analysis — Student demand, degree production and competitive market share in one view.
PRODUCT SCREEN 03
Opportunity Scoring & Assessment
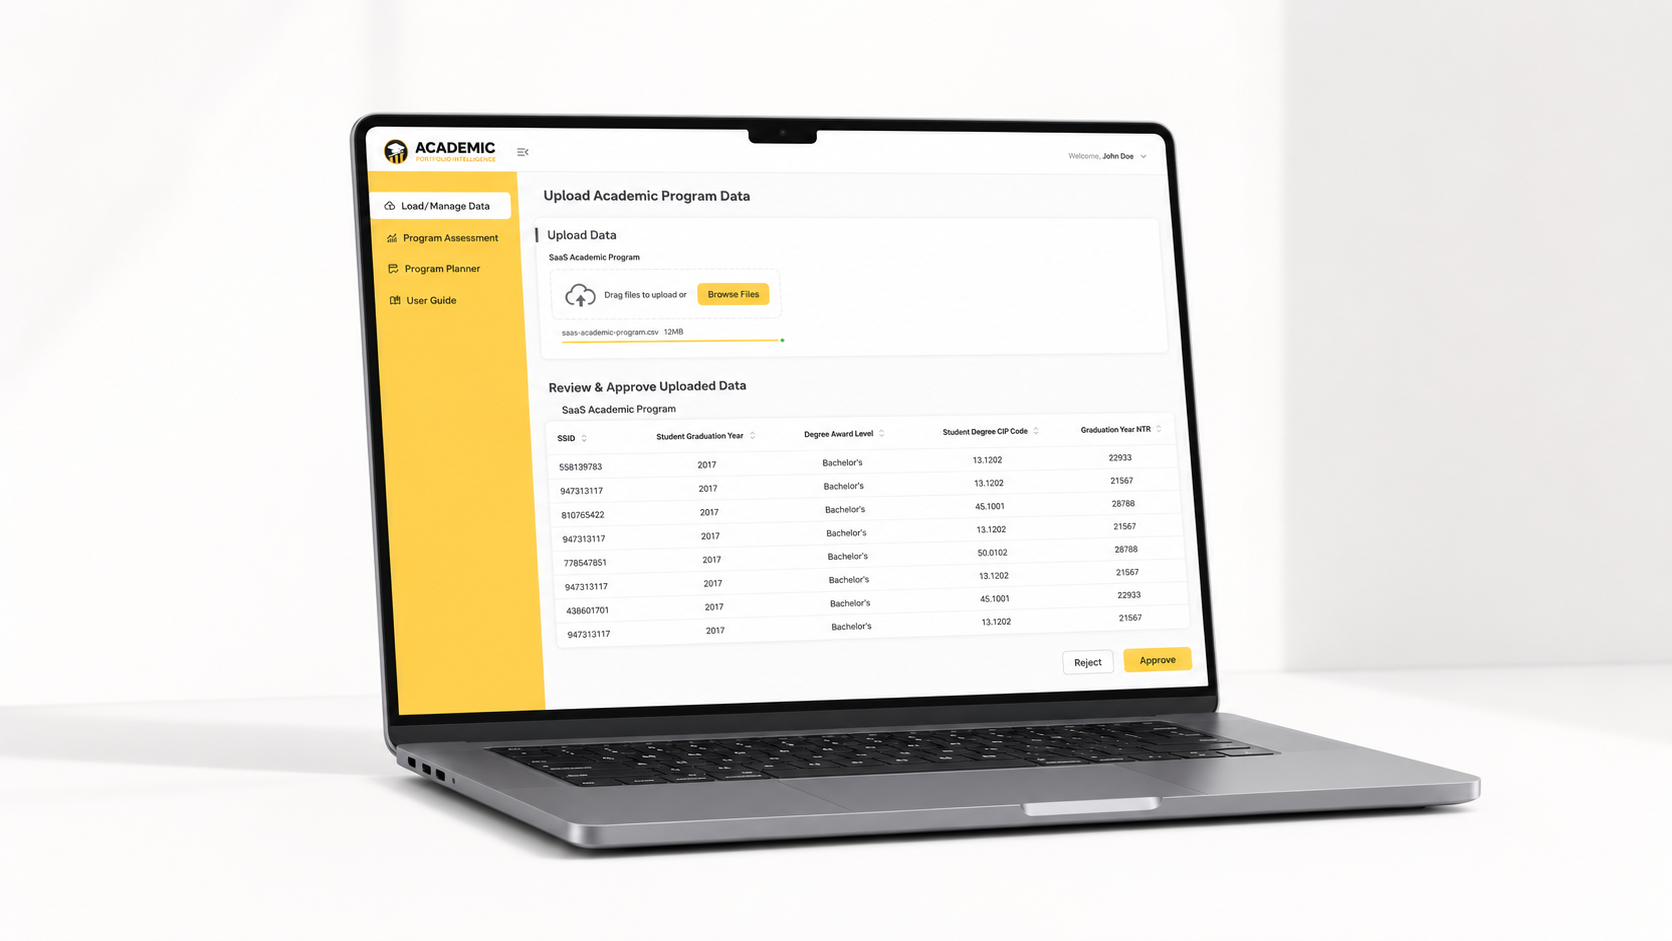
Opportunity Scoring — Transparent program assessment connecting demand, competition and financial opportunity.
PRODUCT SCREEN 04
Academic Program Planner
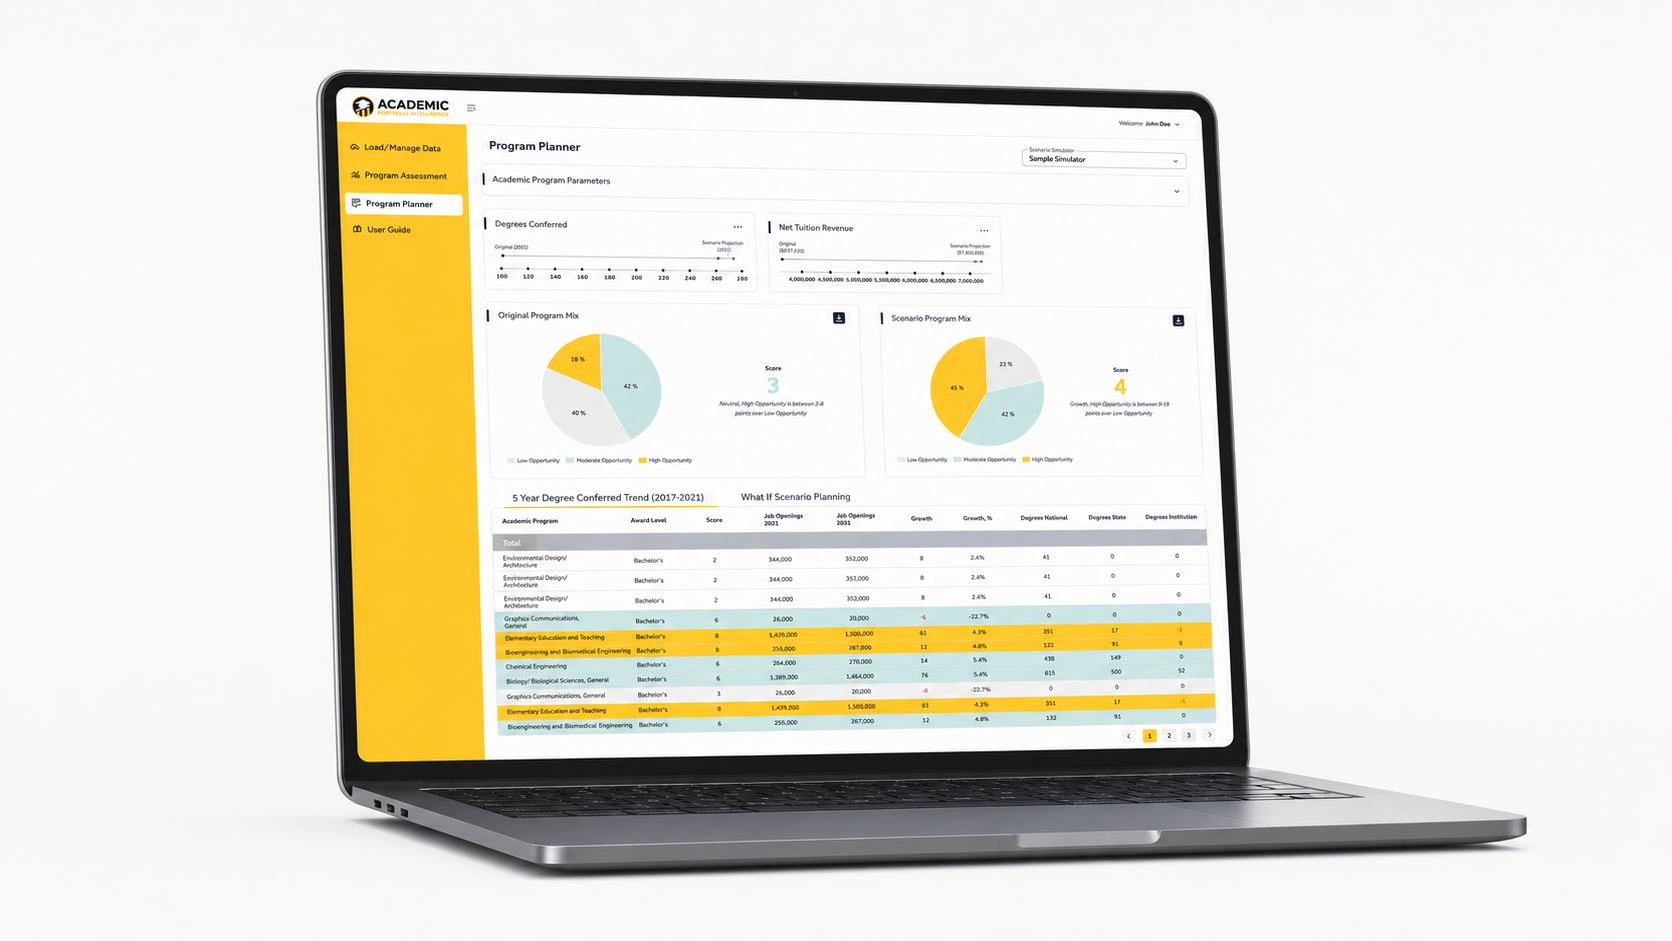
Academic Program Planner — Portfolio scenario modelling and program-mix analysis for strategic planning.
Key Design Decisions
Lead with Strategic Meaning
Challenge
Academic leaders needed to understand the opportunity implication before interpreting supporting data.
Decision
Show opportunity, risk and strategic implication before the underlying metrics.
Effect
Leaders could understand the portfolio significance of a program more quickly.
Connect Program and Portfolio Views
Challenge
Evaluating programs in isolation could produce decisions that were locally correct but strategically inconsistent.
Decision
Design the experience so individual program assessments were always visible within the portfolio context.
Effect
Leaders could evaluate a program's contribution to the overall mix, not just its standalone performance.
Make Opportunity Scoring Transparent
Challenge
Users hesitated to rely on composite scores when the contributing factors were not visible.
Decision
Keep demand, competition, market share, degree production and financial-opportunity signals connected to the score.
Effect
Users could inspect and communicate the reasoning behind an opportunity assessment.
Support Different Levels of Expertise
Challenge
Provosts and senior leaders required a concise view of opportunity. Analysts required access to the evidence behind the assessment.
Decision
Use progressive disclosure within one shared information model.
Effect
Executives received clarity while analysts retained access to supporting information.
Design for Comparison
Challenge
Evaluating one program at a time did not help leaders prioritise across the portfolio.
Decision
Create consistent comparison structures across programs, markets and portfolio scenarios.
Effect
The product supported portfolio-level prioritisation rather than isolated program evaluation.
Connect Planning with Modelling
Challenge
Leaders needed to understand how a program decision might affect the broader portfolio before committing resources.
Decision
Connect the opportunity assessment directly to the portfolio-planning and scenario-modelling workflow.
Effect
Leaders could move from identifying an opportunity to exploring its portfolio implications within one experience.
Separate Institutional from Market Opportunity
Challenge
A program that was growing nationally might not represent the right opportunity for a specific institution.
Decision
Present market demand and institutional opportunity as related but distinct dimensions of the assessment.
Effect
Leaders could evaluate whether a market opportunity was appropriate for their institution's position and priorities.
One Connected Environment for Academic Planning
Academic Portfolio Intelligence created a connected environment for program evaluation, opportunity assessment, portfolio planning and strategic comparison.
Product Impact
- Connected program demand, competition and market share.
- Created a transparent opportunity-scoring model.
- Supported portfolio-level program comparison.
- Enabled program-mix health assessment.
- Connected individual programs to portfolio context.
- Supported scenario modelling for program changes.
- Helped leaders identify portfolio gaps and concentrations.
- Delivered the experience through a live enterprise SaaS environment.
User Impact
Academic Leaders
Gained a connected view of program demand, market position, competitive presence and financial opportunity within one planning environment.
Enrollment Analysts
Could evaluate program viability and portfolio health through a shared model rather than assembling evidence from separate reports.
Strategic Planning Teams
Could explore portfolio alternatives, compare program-mix implications and communicate a defensible academic-investment direction.
Provosts & Senior Leaders
Worked from a shared view of portfolio health, opportunity distribution and strategic program priorities.
Business Value
The platform supported a more connected approach to academic-portfolio strategy—linking program evaluation, opportunity assessment, portfolio planning and institutional decision-making.
3E publicly markets the platform as reducing academic-planning analysis from months to minutes.
Working Beyond the Interface
My contribution extended beyond designing screens. I helped the team create a shared understanding of:
Stakeholder Facilitation
I worked with academic leaders and analysts to separate requested reports from the decisions they needed to make. The key questions included: What decision follows this analysis? What prevents the decision from being made confidently? Which program signals create the greatest uncertainty? What portfolio context is required? What action follows the selected direction?
Workflow Analysis
I mapped how academic-planning information moved between reports, research activities, planning discussions and leadership communication. This revealed where teams were spending effort assembling evidence rather than evaluating portfolio strategy.
Cross-Functional Alignment
I collaborated with product, data and engineering to ensure that opportunity-scoring logic remained understandable, program and market dimensions used consistent definitions, portfolio views worked alongside individual program assessments, and the experience supported both evaluation and planning.
Reusable Product Patterns
What This Project Reinforced
01
Portfolio Context Changes the Meaning of Individual Programs
A program that appears strong in isolation may be redundant, misaligned or strategically unnecessary when viewed within the full portfolio.
02
Opportunity Scoring Only Works When It Is Transparent
A composite score accelerates understanding only when users can inspect the contributing factors and understand how the assessment was formed.
03
Market Demand and Institutional Fit Are Different Questions
A growing national market does not automatically represent the right opportunity for a specific institution. Both dimensions need to be visible.
04
Academic Planning Is Already Scenario Planning
Leaders naturally think in terms of alternatives and implications. The design challenge is making those relationships explicit and explorable.
05
Executives and Analysts Need One Truth at Different Depths
Progressive disclosure can support different levels of expertise without creating disconnected planning models or separate analytical environments.
06
Speed Matters When Markets Are Changing
Lengthy research cycles increase the risk of acting on outdated information. Reducing the distance from question to assessment is a strategic advantage.
07
The Portfolio Decision Is More Than the Sum of Program Decisions
Institutional investment direction requires understanding trade-offs, concentrations, gaps and the collective effect of individual program choices.
08
The Decision Is the Product
Dashboards, scores and reports are enabling mechanisms. The real outcome is the institution's ability to make and defend a more confident academic-investment direction.
Selected Product Screens
Four views from the connected academic-planning experience.
Academic Portfolio Intelligence gave our leadership team a shared way to evaluate programs and make portfolio decisions with confidence. For the first time, we could see demand, competition and opportunity in one place—and actually agree on a direction.
Why This Project Matters
Most academic analytics products stop after explaining what has already happened.
Academic Portfolio Intelligence helps institutions understand the current condition of their program portfolio, evaluate where the strongest opportunities exist, assess how competitive the market is and model how program decisions may affect enrollment and revenue before committing institutional resources.
It also connects individual program decisions to portfolio-level strategy—helping leaders understand trade-offs, gaps and concentrations rather than evaluating each program in isolation.
That shift—from fragmented program reporting to connected, evidence-based portfolio decision intelligence—is where the product creates its greatest value.
DESIGNING FOR THE PORTFOLIO DECISION
Academic intelligence should lead to portfolio direction—not another program report.
Academic Portfolio Intelligence was not designed to help institutions display more program data. It was designed to help leaders answer:
- Which programs represent the strongest opportunities?
- Where is the portfolio concentrated, underserved or at risk?
- How might a program change affect the broader portfolio?
- Which academic-investment direction is most defensible?
That is the difference between an academic dashboard and a portfolio decision-intelligence system.
EVIDENCE NOTE
All content on this page reflects the scope of my design contribution and the product capabilities I helped design. The vendor-positioning claim ("3E publicly markets the platform as reducing academic-planning analysis from months to minutes") is attributed to 3E's public marketing and is not presented as a personally measured project result. No revenue figures, adoption rates, research-participant counts or institution names have been invented or included.