HIGHER EDUCATION · DECISION INTELLIGENCE
Enrollment Decision Studio
Transforming fragmented enrollment reporting into proactive decision intelligence.
Higher-education leaders make critical decisions about recruitment, enrollment targets, market investment and institutional growth. Yet planning often depends on disconnected reports, manually maintained spreadsheets and historical comparisons that provide limited visibility into future outcomes.
I led the product design of Enrollment Decision Studio, a decision-intelligence experience within the 3E ForwardIQ ecosystem. The platform helps higher-education teams track enrollment velocity against goals, understand market performance, model future run rates and explore strategic scenarios through a unified SaaS environment.
PROJECT FOCUS
From retrospective reporting to proactive enrollment planning
Connecting pace-to-goal tracking, run-rate modelling, market context and strategic scenario planning in one enterprise experience.
The Decision at a Glance
SITUATION
Fragmented planning limited future visibility
Enrollment leaders could review historical reports and current funnel activity, but they lacked a connected way to understand whether enrollment was progressing at the required pace. Planning information existed across reports, spreadsheets and institutional systems. Teams had to reconcile the information manually before evaluating future enrollment, market position or strategic alternatives.
TASK
Turn reporting into a shared planning model
My responsibility was to design an experience that helped enrollment teams track daily progress against goals, understand enrollment momentum, connect institutional performance with market expectations, review future run rates and communicate a clear strategic direction.
ACTION
Design around the complete decision loop
I mapped the planning workflow and structured the experience around three connected decision layers: Understand current performance → Predict future outcomes → Simulate strategic alternatives. I led the design of the executive intelligence view, Pace to Goal experience, run-rate modelling workflow, scenario-planning interactions and decision-summary structure.
RESULT
One connected environment for planning
The platform created a shared SaaS experience for enrollment monitoring, forecasting and strategic planning. Enrollment teams could move away from disconnected spreadsheet-driven analysis and connect current performance, long-range projections, market context and strategic alternatives within one environment.
Product Capabilities
Enrollment Planning Was Built Around Fragmented Information
Enrollment teams had access to significant amounts of data, but the information was often separated by system, department and reporting period.
Reports Explained the Past
Reports could answer questions such as:
- How many inquiries have we received?
- How many applications are complete?
- What was the previous conversion rate?
- How does current enrollment compare with last year?
Leadership Needed to Plan the Future
Leadership needed answers to more strategic questions:
- Are we progressing quickly enough to reach the goal?
- Is our market share increasing, stable or declining?
- What is the likely long-term enrollment trajectory?
- Which assumptions are influencing the projection?
- What happens when a market or conversion assumption changes?
- Where should institutional resources be focused?
The Existing Workflow
Export information from multiple systems
Teams pulled data from enrollment management systems, CRM platforms, institutional databases and external market sources — each with different formats, update cycles and definitions.
Fragmented Planning
Enrollment activity, institutional goals, historical performance and market information existed across disconnected reports and workflows.
Spreadsheet Dependence
Teams relied on manually maintained spreadsheet models to calculate pace, projections and planning scenarios.
Retrospective Visibility
Traditional reports showed what had already happened but provided limited support for understanding what was likely to happen next.
Strategic Misalignment
Different teams could interpret the same enrollment situation differently because they were working from separate reports and assumptions.
THE DEEPER PROBLEM
The institution did not simply need more enrollment data.
It needed a shared way to understand momentum, evaluate future possibilities and align around a course of action.
Move from Reporting to Decision Intelligence
FROM
What happened?
TO
Are we on track, what is influencing the outcome and what should we do next?
"How might we help enrollment leaders connect current performance, market context and long-range projections so they can make more confident strategic decisions?"
My Mandate
As Lead Product Designer, I was responsible for translating a complex enrollment-planning model into an experience that could support both executive and analytical users.
Success Criteria
Key Constraints
Forecasting Complexity
The planning model connected institutional goals, historical performance, market data, enrollment velocity and strategic assumptions.
Different User Needs
Executives needed a rapid understanding of progress and risk. Analysts needed access to the information behind the projection.
Trust
Users needed to understand why a projection or pace assessment had changed before acting on it.
Data Density
The product needed to present substantial analytical information without recreating the complexity of spreadsheets.
Organisational Alignment
Enrollment leadership, analysts, product, data and engineering needed to work from consistent definitions and one shared planning model.
Understanding the Decisions Behind the Reports
Discovery focused on how enrollment teams evaluated progress, which information influenced their planning and what decisions followed the analysis.
The objective was not simply to identify requested charts. It was to understand the strategic questions hidden beneath those requests.
Workflow Mapping
I mapped how enrollment-planning information moved between:
Much of the planning effort was spent assembling and interpreting information before teams could begin evaluating strategic options.
INSIGHT 01
Leadership Cared About Progress Toward the Goal
Stakeholders did not simply want to know how many applications or enrollments had been recorded. Their primary question was: "Are we progressing at the pace required to achieve the goal?" This changed the dashboard hierarchy. The experience needed to lead with pace, trajectory, variance and potential action.
INSIGHT 02
Historical Comparison Was Not Enough
Week-over-week and year-over-year comparisons provided context, but they did not fully account for market conditions, institutional trajectory or long-range strategy. The product needed to connect current performance with broader market expectations and historical trendlines.
INSIGHT 03
Forecasts Required Visible Assumptions
Users needed to understand which institutional goal was being measured, which historical information influenced the projection, which market conditions were considered, which variable had changed and why the projected outcome had moved.
INSIGHT 04
Every Enrollment Strategy Was Already a Scenario
Planning discussions regularly included questions such as: What happens if conversion improves? What happens if yield declines? What happens if a market grows? The organisation was already thinking in scenarios. The existing process simply made scenario analysis slow and disconnected.
INSIGHT 05
Executives and Analysts Needed One Truth at Different Depths
Executives needed the conclusion first. Analysts needed to inspect the supporting information. The solution was one shared model with progressive levels of detail.
INSIGHT 06
Comparison Was as Important as Projection
A projection could describe one possible future. A strategic decision required users to compare alternatives, understand their implications and determine which direction was most defensible.
Designing Backward from the Decision
The central design challenge was architectural rather than visual. Instead of beginning with dashboards, I mapped the complete decision loop and worked backward from the action enrollment leaders needed to take.
CONNECT THE INFORMATION
Bring institutional performance, goals, historical trends and market information into one planning environment.
ASSESS CURRENT PACE
Show whether enrollment activity is progressing at the rate required to achieve the institutional goal.
MODEL THE FUTURE
Translate current performance and planning assumptions into future enrollment run rates.
ADJUST A STRATEGIC VARIABLE
Allow users to modify assumptions related to conversion, yield, market contribution or enrollment strategy.
COMPARE THE ALTERNATIVES
Help users understand how each scenario affects the projected outcome.
ALIGN AROUND A DIRECTION
Surface the implications and rationale required to select a strategic plan.
TRACK PROGRESS
Create an ongoing structure for reviewing progress and maintaining alignment as the strategy is implemented.
Three Decision Layers
UNDERSTAND
What is happening now?
Current enrollment activity, institutional goals, pace, historical performance and market position.
PREDICT
What is likely to happen?
Current momentum and planning assumptions translated into future enrollment run rates.
SIMULATE
What happens if something changes?
Strategic assumptions can be modified and their potential impact compared.
Design Principles
01
Outcomes Before Data
The primary view led with current pace, progress against goal, projected direction, variance, market position and potential action. Supporting metrics remained available beneath the conclusion.
02
Transparent Forecasting
Institutional goals, historical trendlines, market expectations and modified assumptions remained visible so users could understand why a projection changed.
03
Progressive Disclosure
Executives could understand the strategic implication without navigating through analytical detail. Analysts could inspect contributing information when required.
04
Goal-Centred Visualization
Every major visual answered a planning question: Are we on track? Is our momentum improving or declining? How do we compare with the market? Where is the gap?
05
Cause and Effect in One View
The assumption a user changed and the resulting impact remained visible within the same workflow.
06
Comparison Before Commitment
The product allowed teams to evaluate possible directions before selecting and communicating a preferred plan.
07
Planning as an Ongoing Process
The experience was designed to support continuing progress reviews rather than treating strategic planning as a one-time exercise.
Core Product Experience
PRODUCT SCREEN 01
Executive Enrollment Intelligence
The executive experience brought the institution's most important enrollment signals into one decision surface.
Questions answered:
- 1.Are we progressing toward the goal?
- 2.Is our pace improving, stable or declining?
- 3.How does our position compare with market expectations?
- 4.What is the likely future direction?
- 5.Where may intervention be required?
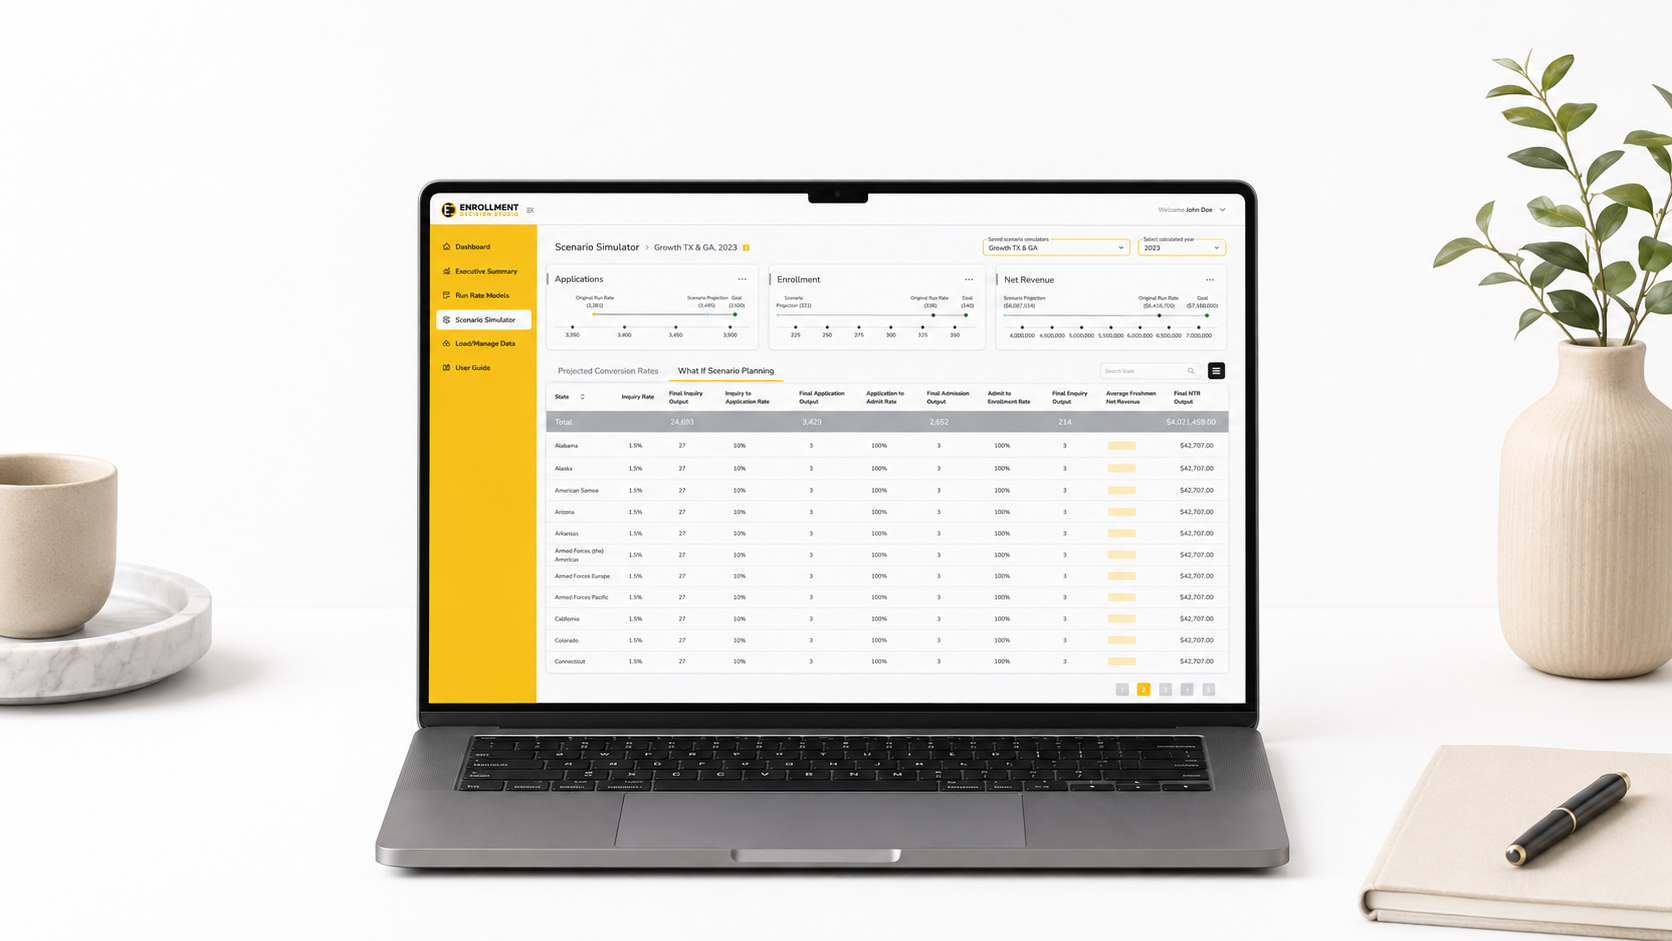
Executive Enrollment Intelligence — A unified view of institutional performance, pace and projected direction.
Before
Executives relied on several reports and analyst-prepared summaries to understand enrollment performance.
After
They could review progress, pace, market context and projected direction through one connected experience.
Design Rationale
Pace and projected direction appeared before supporting metrics because the primary user need was understanding whether action was required.
PRODUCT SCREEN 02
Pace to Goal
Pace to Goal helped enrollment teams understand whether current activity was moving at the rate required to achieve institutional targets.
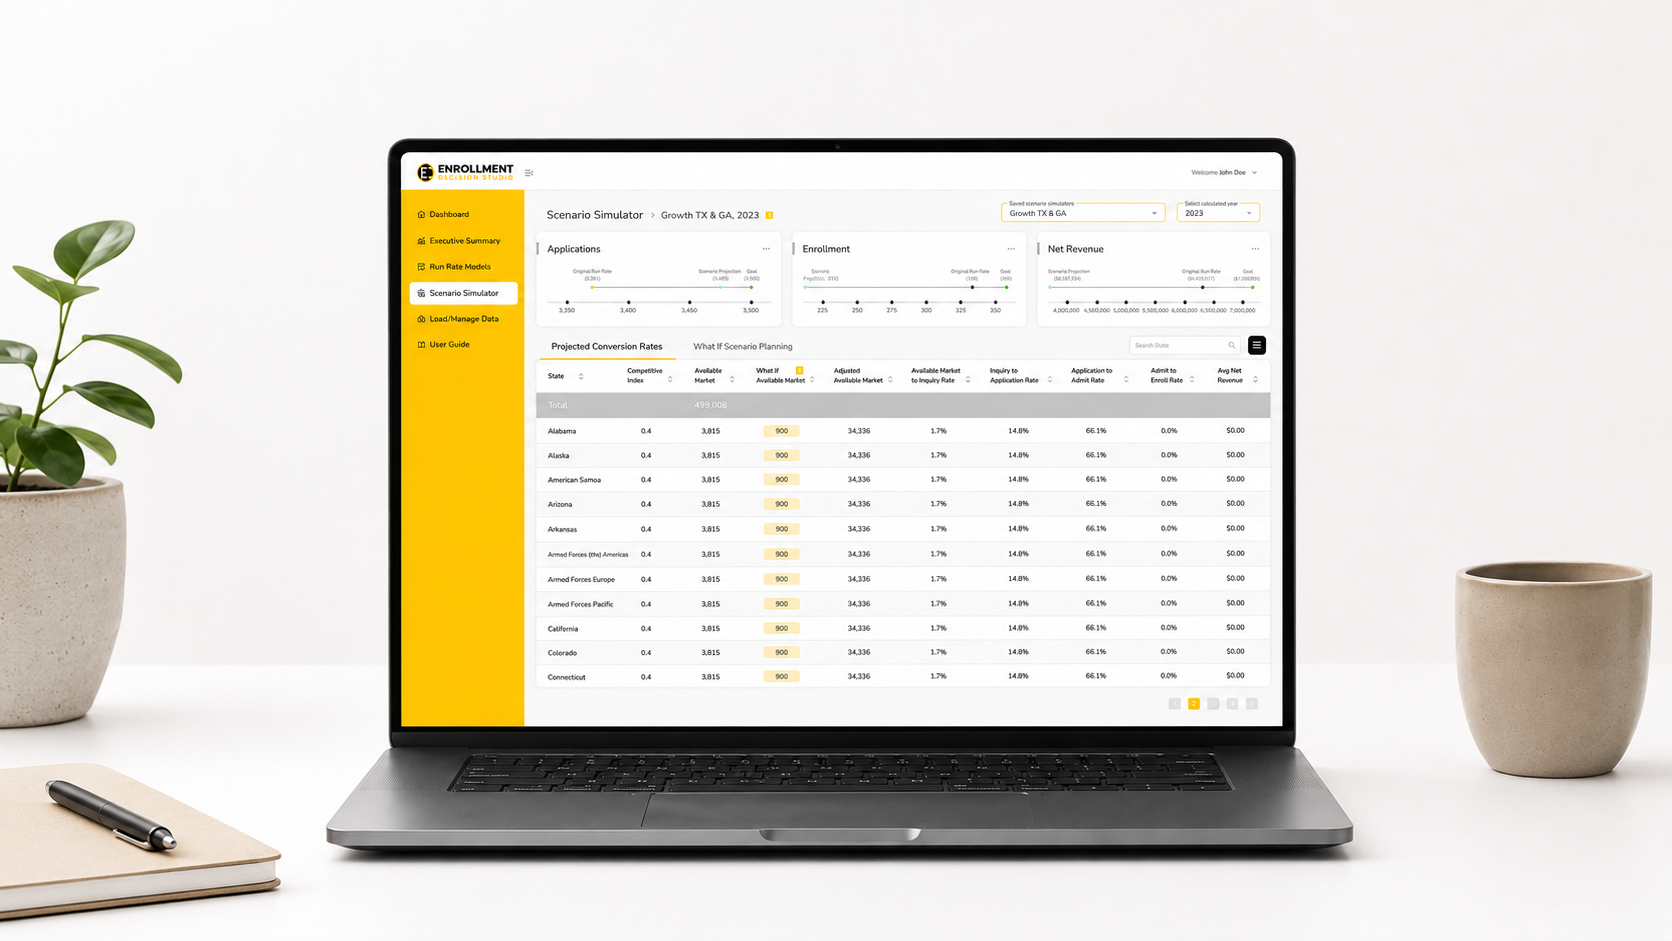
Pace to Goal — Enrollment velocity interpreted against goals, historical trends and market expectations.
Design Rationale
Pace was presented as a relationship between current performance, institutional goals and market expectations—not as an isolated activity count.
PRODUCT SCREEN 03
Run-Rate Modelling
The run-rate experience supported long-range enrollment planning by connecting current performance, institutional information and strategic assumptions.
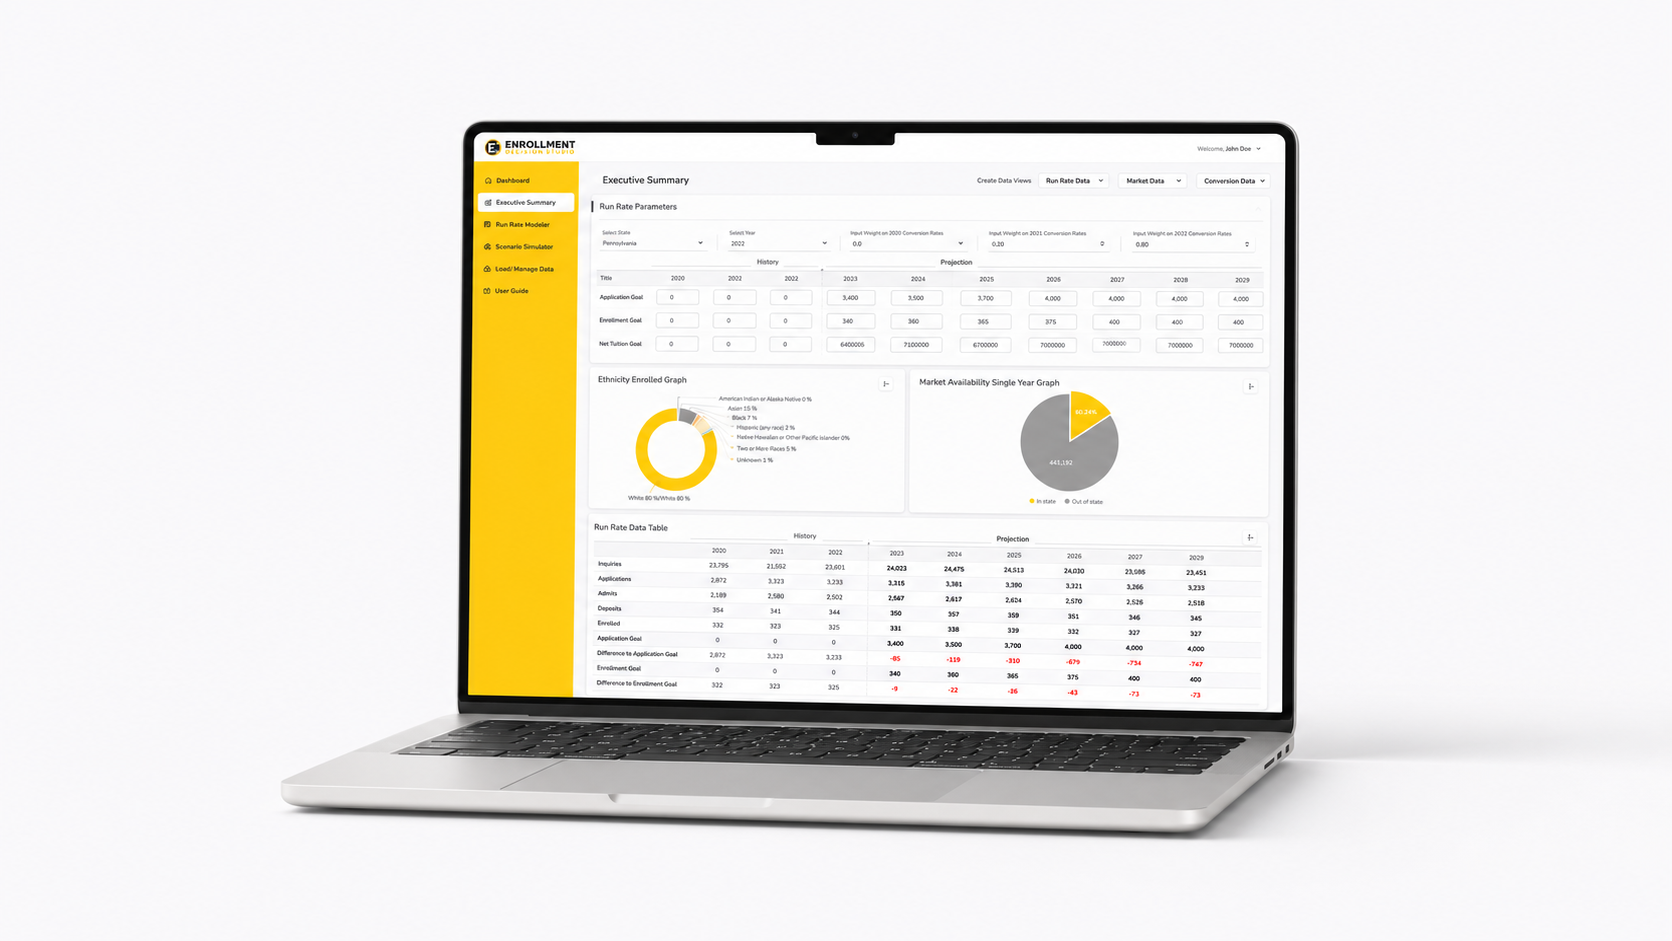
Run-Rate Modelling — Long-range enrollment planning connected to institutional assumptions and future trajectories.
Design Rationale
The platform combined long-range planning with a clear outcome-first hierarchy, helping users understand the projection before examining the underlying detail.
PRODUCT SCREEN 04
Scenario Planning & Strategic Comparison
The scenario-planning experience allowed teams to explore how changes in strategy could influence future enrollment.
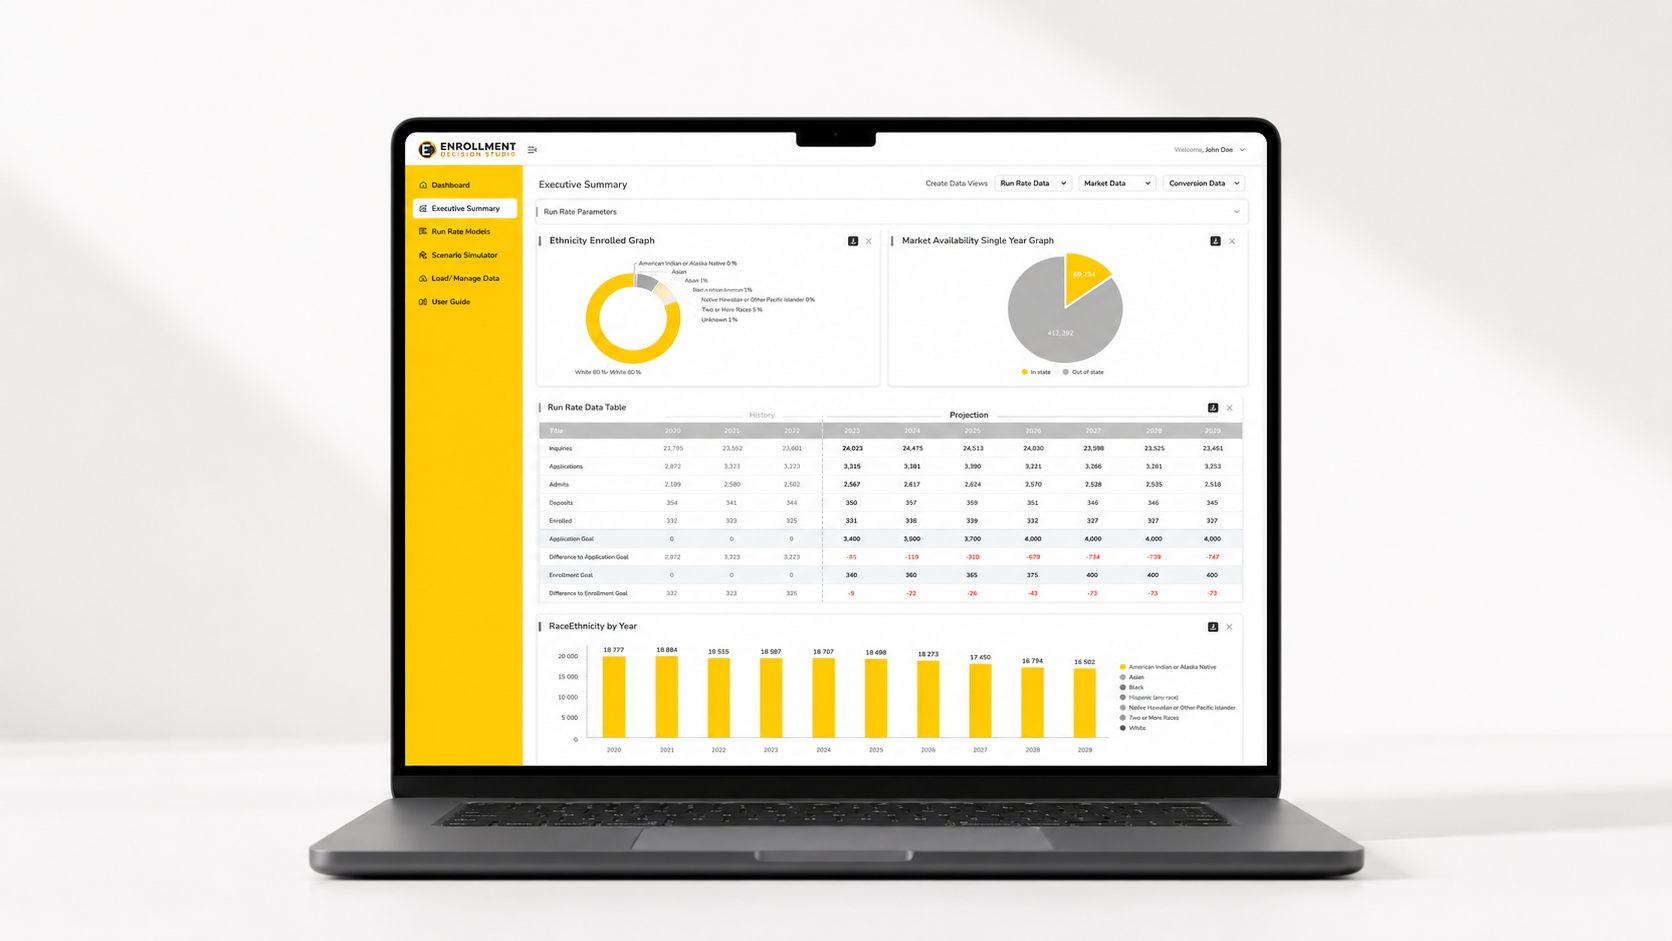
Scenario Planning — Strategic variables, projected outcomes and comparison brought into one planning environment.
Before
A new strategic question required teams to update spreadsheet models and reconstruct the planning narrative.
After
Teams could explore strategic alternatives through a connected planning environment.
Design Rationale
The modified assumption and its projected effect remained visible together. Users could understand what changed, why the projection moved and how the revised scenario differed from the baseline.
Comparing Strategic Directions
Leaders needed more than the ability to create multiple projections. They needed a clear way to evaluate them. The comparison brought together: institutional goals, enrollment projections, run-rate direction, market implications, important assumptions, potential risks and strategic rationale.
Questions answered:
- Which scenario is most aligned with the institutional goal?
- Which assumption creates the greatest difference?
- Which direction carries more uncertainty?
- What are the market implications?
- Which option provides the most defensible strategic path?
From Decision to Ongoing Progress
The selected direction could be translated into a concise planning summary. Strategic planning does not end when a direction is selected. The experience also supported recurring reviews of progress against goals, changes in market conditions, variance from the selected plan, updated assumptions, required interventions and ownership of next steps.
Key Design Decisions
Lead with Pace and Direction
Challenge
Traditional dashboards required users to interpret several metrics before understanding whether the institution was on track.
Decision
Show progress, pace, projected direction and variance before supporting detail.
Effect
Leaders could understand the strategic implication more quickly.
Connect Institutional and Market Context
Challenge
Internal comparisons alone could not explain whether performance reflected an institutional issue or a broader market shift.
Decision
Present institutional performance alongside market expectations and historical trendlines.
Effect
Users gained a more complete context for interpreting changes in enrollment momentum.
Make Forecasting Explainable
Challenge
Users hesitated to rely on projections when the underlying assumptions were unclear.
Decision
Keep goals, trendlines, market context and modified variables visible.
Effect
Users could inspect and communicate the reasoning behind the projection.
Support Different Levels of Expertise
Challenge
Executive and analytical users required different levels of detail.
Decision
Use progressive disclosure within one shared information model.
Effect
Executives received clarity while analysts retained access to supporting information.
Keep Cause and Effect Together
Challenge
Users struggled to understand why an outcome changed when inputs and results appeared in different places.
Decision
Display the modified assumption and projected effect within the same workspace.
Effect
The relationship between the strategic change and projected outcome became easier to understand.
Design for Comparison
Challenge
Creating several scenarios did not automatically help leaders choose between them.
Decision
Create a comparison structure centred on goals, assumptions, direction, market implications and risk.
Effect
The product supported evaluation and alignment rather than projection alone.
Connect Planning with Implementation
Challenge
Strategic plans can lose momentum after the initial planning process.
Decision
Extend the experience into recurring progress reviews and clear next steps.
Effect
The selected strategic direction remained connected to execution.
From Historical Reporting to Active Planning
Enrollment Decision Studio created a connected environment for enrollment monitoring, pace assessment, run-rate forecasting, scenario planning and strategic communication.
Product Impact
- Connected enrollment performance with institutional goals.
- Combined institutional and market context.
- Made planning assumptions visible.
- Supported long-range enrollment forecasting.
- Enabled run-rate and scenario planning.
- Helped teams compare strategic alternatives.
- Connected planning decisions with ongoing progress reviews.
- Delivered the experience through a live SaaS environment.
User Impact
Enrollment Executives
Gained a clearer view of enrollment pace, projected direction, market position and potential strategic interventions.
Enrollment Analysts
Could evaluate institutional performance and planning assumptions through a shared model rather than reconstructing the analysis across separate spreadsheets.
Strategic Planning Teams
Could explore alternatives, compare implications and communicate an agreed direction through one connected workflow.
Cross-Functional Leaders
Worked from a shared view of institutional goals, market expectations and future enrollment possibilities.
Business Value
The platform supported a more connected approach to enrollment strategy—linking daily performance, long-range forecasting, market context, scenario planning and institutional execution.
3E publicly positions ForwardIQ Forecast as a more effective alternative to traditional short-term forecasting methods and has described institutions using Pace to Goal to strengthen enrollment planning and respond to projected changes.
Working Beyond the Interface
My contribution extended beyond designing screens. I helped the team create a shared understanding of:
Stakeholder Facilitation
I worked with enrollment leaders and analysts to separate requested reports from the decisions they needed to make. The key questions included: What decision follows this report? What prevents the decision from being made confidently? Which assumption creates the greatest uncertainty? What market context is required? What action follows the selected direction? How will progress be reviewed?
Workflow Analysis
I mapped how enrollment information moved between reports, spreadsheets, planning discussions and leadership communication. This revealed where teams were spending effort assembling information rather than evaluating strategy.
Cross-Functional Alignment
I collaborated with product, data and engineering to ensure that forecasting logic remained understandable, goals and variables used consistent definitions, market and institutional views worked together, scenario changes produced clear outcomes, and the experience supported both planning and ongoing review.
Reusable Product Patterns
What This Project Reinforced
01
More Data Does Not Automatically Create Confidence
Confidence comes from understanding what the result means, what influenced it and what action is available.
02
Pace Is More Meaningful Than Volume Alone
An activity count becomes strategically useful when it is connected to a goal, a timeline and an expected market trajectory.
03
Market Context Changes the Meaning of Performance
Institutional growth or decline cannot be interpreted fully without understanding the broader environment.
04
Explainability Is Part of the Experience
In a decision-intelligence product, the projection and the reasoning behind it are equally important.
05
Executives and Analysts Should Not Work from Separate Truths
Progressive disclosure can support different levels of expertise without creating disconnected planning models.
06
A Scenario Tool Must Help People Choose
Generating alternatives is only part of the problem. Comparison and strategic implications turn alternatives into a decision.
07
Strategy Requires an Operating Rhythm
A strategic direction becomes meaningful only when progress is reviewed, ownership remains visible and action follows the plan.
08
The Decision Is the Product
Dashboards, models and reports are enabling mechanisms. The real outcome is the institution's ability to make and implement a more confident enrollment decision.
Selected Product Screens
Four views from the connected enrollment-planning experience.
I can't emphasize enough how Enrollment Decision Studio's Modern Strategic Planning has transformed our approach. Our institution now stands out with clear differentiation, and the quarterly progress walks have made our strategic direction not just embraced but truly implemented.
Why This Project Matters
Most analytics products stop after explaining what happened.
Enrollment Decision Studio helps institutions understand their current enrollment pace, evaluate future run rates, interpret performance within a market context and explore strategic alternatives before acting.
It also extends planning beyond the initial decision by supporting recurring progress reviews that connect strategy with implementation.
That shift—from retrospective reporting to proactive, measurable and continuously reviewed decision intelligence—is where the product creates its greatest value.
DESIGNING FOR THE DECISION AFTER THE DASHBOARD
Enrollment intelligence should lead to action—not another report.
Enrollment Decision Studio was not designed to help institutions display more enrollment information. It was designed to help leaders answer:
- Are we moving at the required pace?
- What is influencing our future enrollment?
- Which strategic direction should we take?
- Are we implementing that direction effectively?
That is the difference between an enrollment dashboard and a decision-intelligence system.